Showing posts with label Sentiment. Show all posts

Friday, April 17, 2020

Case Study - BBUS and BBOZ: The First One's Always Free

Those who have been dabbling in stocks during the most recent period of volatility will undoubtedly have gained invaluable experience in the market during the Feb to April downturn and subsequent uptick. In summary, from 19 Feb to 23 Mar, the S&P 500 lost 33.9%, making it the fastest crash in history. This was followed by growth of 17.5% from 24 to 26 Mar, being one of the biggest three day gains for almost a century. It would not be an exaggeration to say that what we lived through was truly extraordinary. What was even more amazing was to watch the market response to these violent movements. 

As my readers will now have discerned, my investment strategy has been a fairly conservative one where I dollar cost average twice a month, largely into index funds and by exception individual shares where they appear to be of exceptional value and worthy of the additional risk involved. Whilst I stuck to my plan throughout, I have found it to be infinitely fascinating to watch the response of average retail investors who succumbed to the dark side and were burned hard by the market. 

In observing the people around me and a plethora of online forums, there were two main poisons which decimated portfolios, one was Put Options, the other was Inverse Indices. Today's topic of discussion will revolve around two highly popular inverse indices, BBUS and BBOZ. 

 
The simple way to explain inverse indices is that it is exactly what the name purports, an inverse of an index fund. While BBUS is a leveraged inverse of the S&P 500, BBOZ is a leveraged inverse of the ASX 200. By utilising futures contracts, every 1% lost in the relevant index results in a 2% to 2.75% gain for the holder. As you can envisage, this became a highly attractive investment vehicle to make some gains during the intense drop. Although it may sound like a good idea to buy when the market is falling, there are a number of reasons why a beginner or even novice investor shouldn't touch these products.

Market Timing

When you buy into index or a fairly stable blue chip share, it is almost an inevitable outcome that the shares will go up in the long run. Since BBUS and BBOZ are inverse indices, they obviously go down in the long run as demonstrated in the chart below.


When you look at the prices for BBUS in the last several months the returns look extremely attractive after the fact. If you bought on 20 Feb for $2.67 per unit, this would have become $6.63 by 23 Mar. However, given the state of the economy on 20 Feb, who would have been able to foresee the impending crash and buy into BBUS? Very few. Given the uncertainties surrounding the impacts of coronavirus on the economy and subsequent fall out, most people held onto their portfolios for at least several days until a downward trend was established when it was somewhat higher in price. I know of at least one friend who put their whole portfolio into BBUS at peak for $6.63.

Given investor psychology surrounding the Dunning Kruger effect, even the investor who bought in at the peak was determined that the falls were not yet over and any minor dips constitute bear market rallies and the big crash has yet to come. Of course the media also fanned flames during this period, hyping up death stats and forecasting the end of civilization as we know it, but the unsavvy investor failed to realise that this was already priced in when the market tanked. As a result of this, they consistently held on whilst their portfolio was was violently wiped out.


As of today, BBUS currently stands at $3.39, almost down to what it started on. Are we in the middle of a massive dead cat bounce and the big crash is still coming, or whether we are in for a V shaped recovery? I don't know, which is why I will continue with my dollar cost averaging. Short of being able to accurately time future market movements, it would be imprudent to purchase such a risky vehicle. Having said that, if you are able to accurately foresee the future, why wouldn't you just maximize your gains on minimal cost by buying next week's lotto ticket and min maxing your profits.

Compounding Risk aka. Volatility Decay

Another reason why leveraged inverse indices shouldn't be held for an extended period of time, but isn't apparent to most until demonstrated by a worked example.

For simplicity, let's do two worked examples on the following parameters:

  • Starting portfolio is $10,000
  • Every day the market moves up or down 1% (10% in the other simulation) returning to parity every second day
  • For simplicity we will take the leverage of inverse index at a multiple of 3.


As you can see, whilst market returned to parity every second day, the value of the portfolio was gradually reduced, whilst the results were subdued when volatility was small, when movements were violent, decay was also extremely brutal. Given the fluctuations of the last several months, I have no doubt that quite a few people suffered considerable losses from volatility decay.

For further clarity, consider the fund strategy that BetaShares proposed for both BBUS and BBOZ whereby returns of 2% to 2.75% for every 1% drop are only for any given day, thereby indicating that those returns cannot be expected to continue for periods over one day.

Expenses

Due to the nature of inverse indices attaining their benchmark leveraged returns through use of complex mechanisms like derivative contracts, the associated expenses of high fees, high transaction costs and re-balancing costs also eat into returns considerably. Although simple, for someone who puts money into ETFs for their low management costs, this is clearly reason why inverse ETFs should be considered with a grain of salt.

Conclusion

The last months have provided me with precious insight into the workings of the human mind and how the fear of loss coupled with greed to make gains have pushed innumerable investors to the dark side. From moderate gains during the remainder of the bear market to the eventual wipe-out with the recent rally, millions have been lost on the market because The First One's Always Free and the lure of quick gains is intoxicating. For this, I am grateful to have held firm to my resolve and weathered the storm.

It has also provided a practical example to ボーイフレンド as to why retail investors often under perform when compared to index returns.


As a final point, for those who are wondering. Mr A, who got bored of checking on his brokerage account and continued to DCA through the dip on a preset diversified spread has now returned to -13% on his portfolio whilst the market is still at -20% from peak, outperforming everyone that I know personally.

By 小福

Monday, March 30, 2020

Obiter Dicta: On Sentiment

My last post provided a fairly light hearted introduction on informal measures of market sentiment, but during these uncertain times I tend to reflect upon the copious amounts of reading I have done on sentiment to try and get an understanding of where we are in the current climate.

Two books that I have recently finished, Mark's The Most Important Thing Illuminated and Neill's The Art of Contrary Thinking highlighted that market sentiment often swings in a pendulum like motion between extreme fear and extreme greed. One way for an investor to make significant gains is to recognise where we are in the market thereby exploiting opportunities as they arise. By and large the most gains can be made when you can keep a cool head and calmly make purchases when the majority of the population are panic selling and selling (or at least reducing purchases) when prices start to overheat. As such, I have spent a considerable amount of time pondering sentiment and relevant indicators and have made the following observations of different gauges.

Quantitative Indicators 

Stock Market Price

It would be hard to argue that there is a stronger indicator of market sentiment than the market pricing itself. In stating the obvious, the current price of a stock clearly represents what the market considers to be fair value as at that one point in time. The PE ratio gives a ratio of earnings per share to each share price which in turn provides rough guidance on whether a share is over or under valued. A further step would be to consider the Forward PE ratio to gauge the expected growth and earnings. The higher the Forward PE ratio the higher the predicted growth of the stock which gives a crude starting point for the market's disposition.

Relative Strength Index

The RSI is a momentum indicator that provides a measurement on whether stocks are currently overbought or oversold. The calculation for RSI is fairly complex:


N is often taken to be 14.

The result is a number between 0 and 100 whereby 50 indicates that stocks are neither oversold or overbought, a number closer to 100 indicates it is overbought and a number closer to 0 signals under bought. A range between 30 and 70 is considered fairly normal.


Using the current example of what has just happened locally, you can see that the market crash at the end of February corresponded to a sharp decline in RSI correlating with in a massive oversell of equities in March. A savvy investor would then recognise the market panic from these charts (amongst all the other factors) and may draw the conclusion that it would be a good time to make some purchases of some good quality value equities for a good price.

Bond Yield Curve

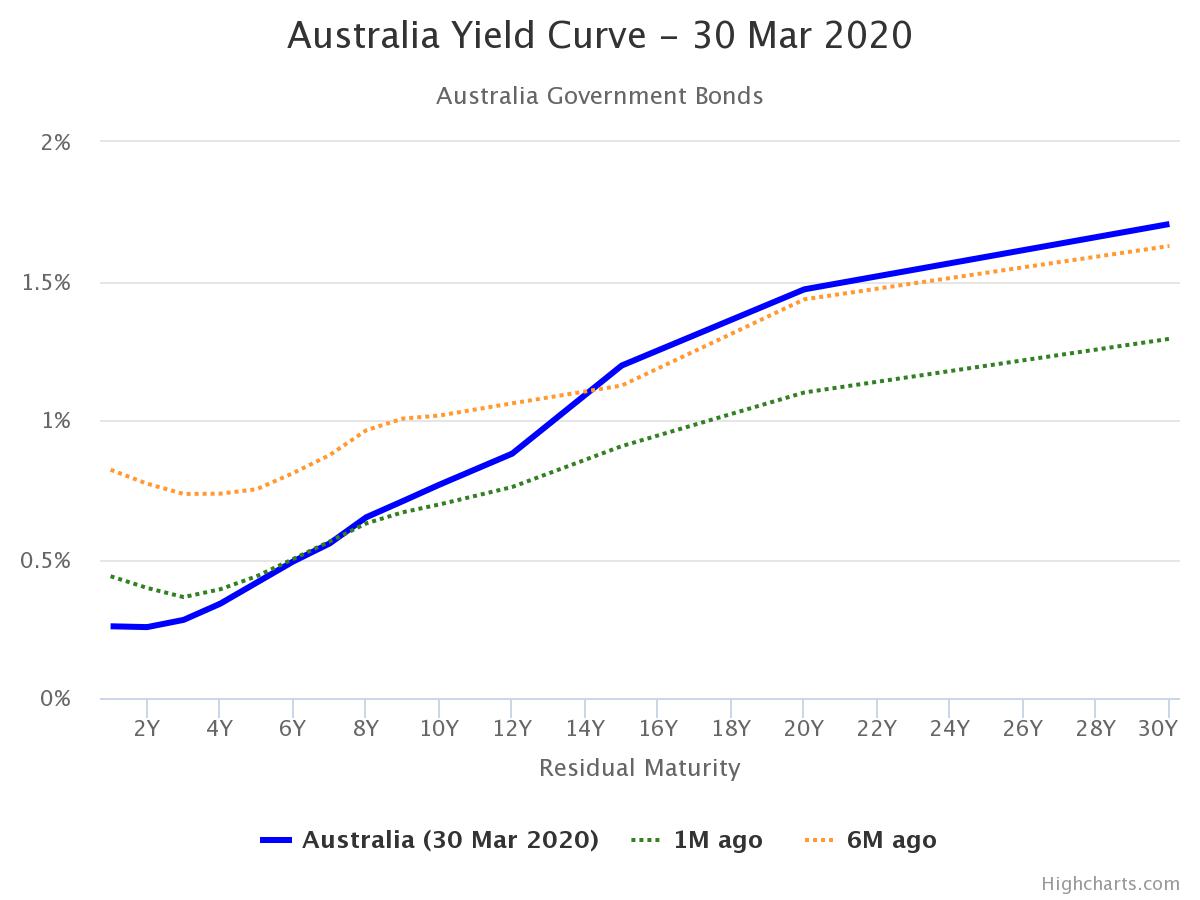
The Bond Yield Curve has recently been cited often as an indicator of impending recession, however there is far more information to be gleaned from it than just the one omen of impending doom. Going back to basics, a bond's yield tells you what the annualised return is from purchase to maturity. As is with the laws of uncertainty, it is riskier to purchase a bond for a longer duration than a shorter one (because you can never really know for certain what will happen in the longer term future) and accordingly in normal situations long term bonds will tend to attract a higher yield than short term.

For reference, our current bond yields in Australia are as follows:


Our current yield curve looks like this:


Different orientations of the curve give different hints to what can be expected in the future.

Normal Curve - has a lower short term yield with a mild increase to mid term and long term. This indicates a normal level of confidence about the future.

Steep Curve - has a lower short term yield with a much greater mid and again much greater long term yield. It is a very bullish signal and has historically correlated with rallies in the stockmarket.

Flat Curve - indicates a lack of investor confidence in the future and is a moderately bearish indicator, although not as bearish as the inverted curve.

Inverted Curve - occurs when short term bonds produce a higher yield than long term bonds. This demonstrates that investors are expecting a drop in yields over the long term as well as a high risk in the short term. This is a very bearish indicator and is often portrayed by the media as a sign that a recession is imminent, whether or not that is true is another matter for a separate debate.

Qualitative Indicators

Pendulum of Hysteria and Euphoria - Changing times?


Moving away from the highly technical quantitative indicators, I find that having an understanding of investor mood through qualitative signs is also important in pinpointing where we currently are on the pendulum swinging between hysteria and euphoria.

There are a number of sources that I have referred to, each with their own limitations. The news is an obvious starting point but the media always sells more by playing up the fear factor, so this often ought to be taken with (at least) a grain of salt. Friendly conversation with friends and coworkers can also provide insight into what your peers are thinking, but of course you are narrowing down your sources to your acquaintances which may only represent a small segment of broader society.

A resource that I have found somewhat insightful over the years is Reddit, specifically the subs investing, fiaustralia, ausfinance and wallstreetbets. Although you are also limited to a demographic of people who are clearly computer savvy enough to post and engage with the online community, it provides a less biased account of reality.

A snapshot of some posts on Ausfinance today results in the following:

For those who are reading this post after the fact (which will probably be most of you), the ASX dropped 36% from a peak of 7162 on 20 Feb 2020 to a recent trough of 4546 on 23rd of Mar 2020 and has since rebounded quite violently 13% to 5181 today 31st Mar 2020. Since the initial panic that was caused by the crash which lead to a considerable amount of selling off (see RSI) there have been a notable amount of investors who have joined the bear gang and attempted to recoup losses by way of buying inverse indices such as BBUS and BBOZ or for the more sophisticated traders buying put options. This had been going on for a couple of weeks now and resulted in a number of oversimplified principles  such as "buy puts = free money" "all in BBUS". The mood on the relevant boards quickly changed from despair to euphoria when the masses of retail investors learned that they could grow their wealth at an accelerated rate by using these highly risky, leveraged products.

As mentioned above, we have since experienced a considerable uptick in the last week and the posts in the screenshot provide a good indicator of how the typical retail investor is reacting to this market movement. From hope of a bearish future with the prospect of incoming defaults and further falls anticipated in equities to the user who invested his whole life savings into BBUS and BBOZ it is clear that they are all anticipating further falls in the market. Whether or not we have reached the extreme end of the pendulum is anyone's guess but these posts seem to indicate that even if we haven't, we ought to be fairly close.

Another interesting note on the matter though, traditionally retail investors were not sophisticated enough to buy inverse indices or puts as these products have only been made available to the masses relatively recently. I would suggest that with these products being made available, an adjustment to our pendulum ought to be made to reflect this, since once the market has clearly taken on a downward trend, euphoria can be found in retail investors who have bought inverse indices or puts where traditionally there would only be hysteria. It would seem that now hysteria only really arises when the market turns and those who missed the signals are caught like a deer in the headlights.

Keynesian Beauty Contest

One final qualitative measure that I will touch upon today is the Keynesian Beauty Contest. For those who are unaware, rather than the traditional beauty contest where participants are asked to choose who they consider to be the most beautiful, they are asked to choose who they think will be voted most beautiful, i.e. crowd consensus. In other words, it constitutes a game of sentiment whereby the winner is the person who can guess better than the crowd as to how the crowd will behave.

In applying this back to our current situation with Covid and the lockdown that I find myself in, we have seen not infrequent headlines whereby the crowd has bought into the hype that the shutdown that we face will be ongoing for months on end, tens of millions of people around the world will die from this virus and the markets will never recover ever again. The most important question though is that although this is what the crowd believes will happen, is this likely to be a realistic outcome given our fundamental understanding of human nature? I would argue that it is not.

In closing, I would like to round off this post with some words from, Warren Buffett, “Be Fearful When Others Are Greedy and Greedy When Others Are Fearful”.

by 小福